
/ Price Chart
Raw price history. Every drop, every spike.
Paste a link and the chart loads the full movement — no smoothing, no editorial framing. The pattern is either there or it isn't.
Historical Low
90-Day Average
Trend Direction
Dropping — 3 of last 5 days
$24.99
$38.40
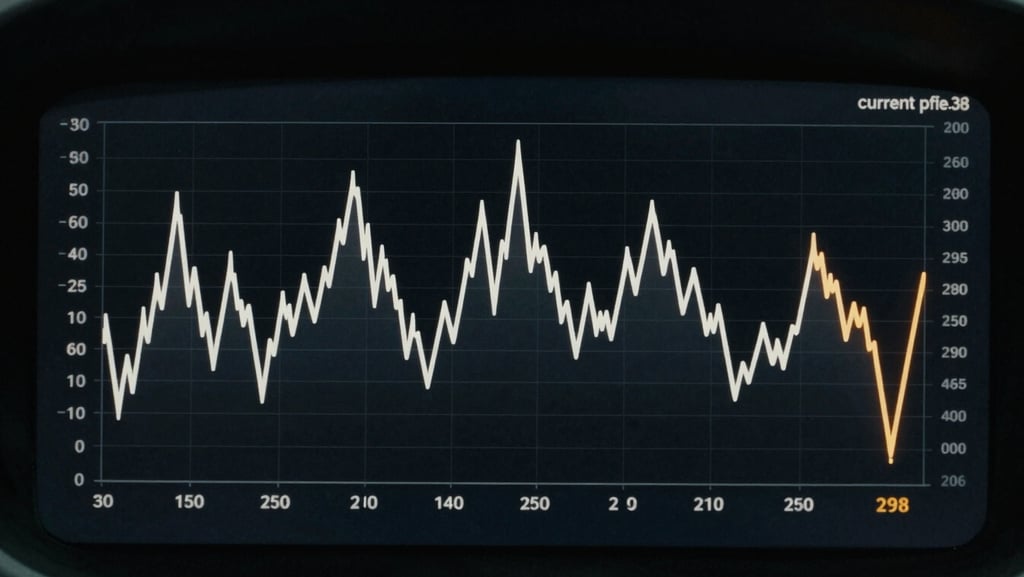
90-day price movement
Updated 2 min ago
Every recorded price point plotted without smoothing. Spikes and drops appear as they happened — the chart earns its own read.
— Live Retailer Prices
Where it's cheapest right now
Prices pulled directly from each retailer's live feed. The amber row is the current floor — the others show how far off they are.
Lowest — Amazon
Walmart
Target
Best Buy
$29.99
$33.50
$36.00
$39.99
Down $8.41 from 7-day avg. In stock, ships today.
+$3.51 above floor. In stock, standard shipping.
+$6.01 above floor. In stock, pickup available.
+$10.00 above floor. Limited stock, no promo.